By the end of this module, you’ll gain experience with automating cloud-based tasks, as well as understanding and using automation tools for managing and optimizing your applications.
Module videos:
Cloud Automation
Now bear with me…
What if…we…turned our infrastructure into code?
Well, we can! Let’s take the requirements that we need for an infrastructure (servers, VMs, etc.) and turn them into code-based templates (that can be both read by humans and machines). By turning our needs into templates, we can very easily create the environments required to run our core processes up on the cloud.
A nice bonus is that you can track such templates in revision control systems (e.g., git, subversion, etc.) as your needs adapt. It should also go without saying, but if you create a template then you can very quickly spin up new resources in the event of a disaster, even automatically.
Here’s an overview of Infrastructure as Code (templating) and other automation possibilities up in Google Cloud.
Module video Automation Overview [11:32]
So, time to talk about Cloud Deployment Manager.
Cloud Deployment Manager
Figure 1 gives an overview of the Cloud Deployment Manager.
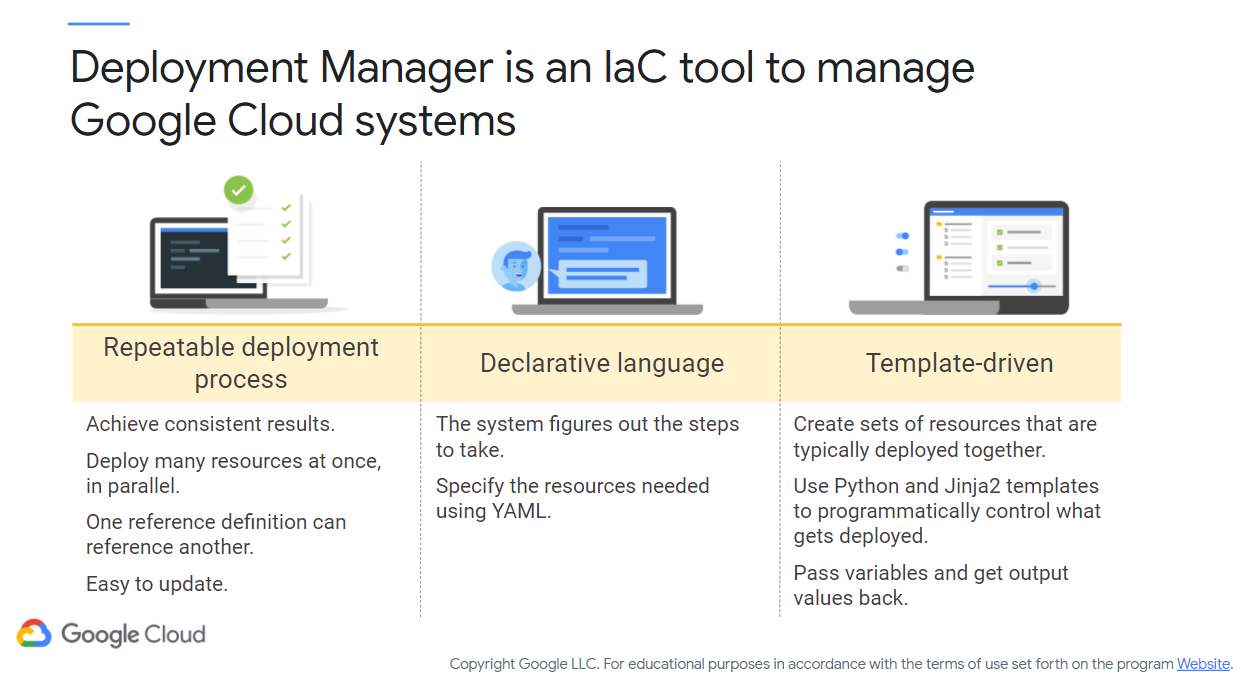
Figure 1: Cloud Deployment Manager
Consider all of the tasks you need to orchestrate as a budding cloud applications developer. You will need to understand how to spin up resources in multiple locations and at multiple levels of abstraction (IaaS, PaaS, SaaS) and more than likely need to do this more than once! Consider if you were to setup a set of VMs for your team. You will need to manage not only the resources themselves, but access to those resources, ensure they are properly accessible, secure, etc. Now consider turning all of these activities you would do by hand in a web interface into a template. It nearly becomes your typical infrastructure-based scripting task (creating bash/PowerShell scripts to deploy resources, etc.).
Deployment Manager uses YAML, a specification format commonly used for defining configuration files. Other open-source tools are supported for performing deployments, including Terraform, Puppet, Ansible, Packer, and Chef.
Things we care about
When performing deployments, we are mainly interested in ensuring that our deployments are running correctly, however we’ll also need to be concerned about what is happening while they do so. Figure 2 (c/o Google) shows some of the activities we’ll need to keep up with.
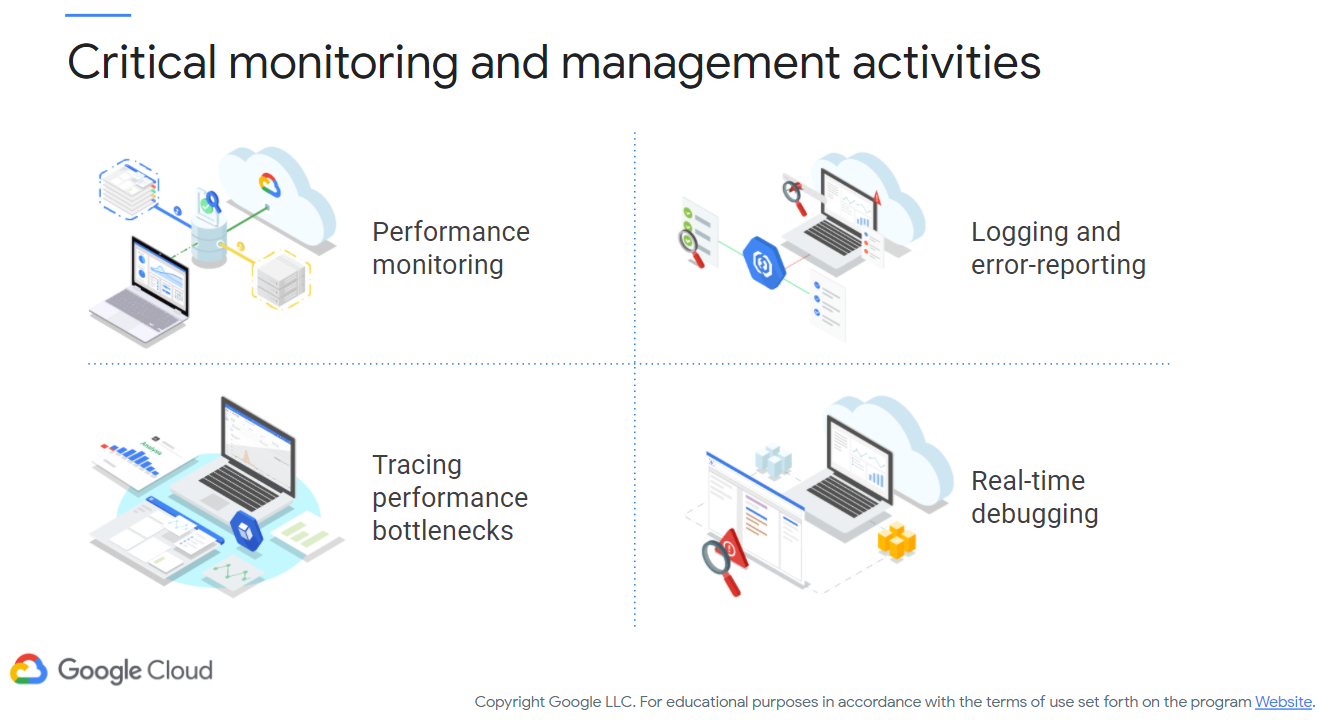
Figure 2: Critical Monitoring and Management Activities
These activities include:
- Performance monitoring
- Logging/error reporting
- Performance bottlenecks
- Real-time debugging
Let’s say we’ve done a successful deployment of some web application, infrastructure, service, etc. (hint: you’ll be doing this very shortly). You will care about providing an acceptable level of performance, uptime, and health of your deployed service. How do we know that and/or measure that?
We’ll need to gather metrics, events, and metadata from the various components you already have experience with. These can include cloud-based logging services that you’ve seen already, or custom logs that you create as part of your service/application. If an error occurs then you should raise an alert so that it can be easily identified when parsing through your logs. Applying filters to your logs will help immensely as well given that there will be a lot of it to get through…
But what about that quality of service (QoS)? QoS can manifest through laggy requests, seemingly-slow performance, etc. Effectively, you will need to be able to triangulate where bottlenecks occur and how to manage them.
How do we do these things (at least, in Google Cloud)? Well….Figure 3 (c/o Google) shows the tools you can use to do this:
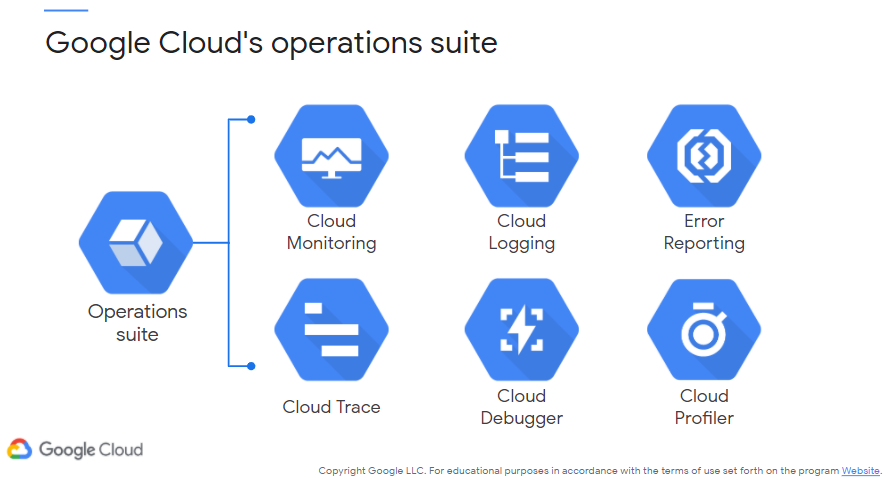
Figure 3: Google Cloud Operations Suite
First things first, here’s a demo running through how we can use Cloud Build and Cloud Run to deploy projects:
- Module video: Cloud Build/Run Demo [14:20]
- Codelab
- Concurrency
And here’s another one checking out Cloud Run Jobs (a way to schedule your containerized application executions!):
Note - ensure you checkout the cleanup instructions in the video description!
We’ll now go into what these tools do for you, however they effectively provide insights into your various services, deployments, containers, etc.
Forewarning: lots of Google-provided slides in the following sections!
Cloud Monitoring
Cloud Monitoring is a full-stack monitoring service that provides insights into your cloud-based resources automatically. Expect dashboards and visualization tools to give you nice overviews (and detailed views) of trends that may impact your applications. Effectively, you get an aggregated view of your cloud that prevents you from having to go into each separate service to perform your monitoring/analysis tasks. You can drill down to get more information as needed.
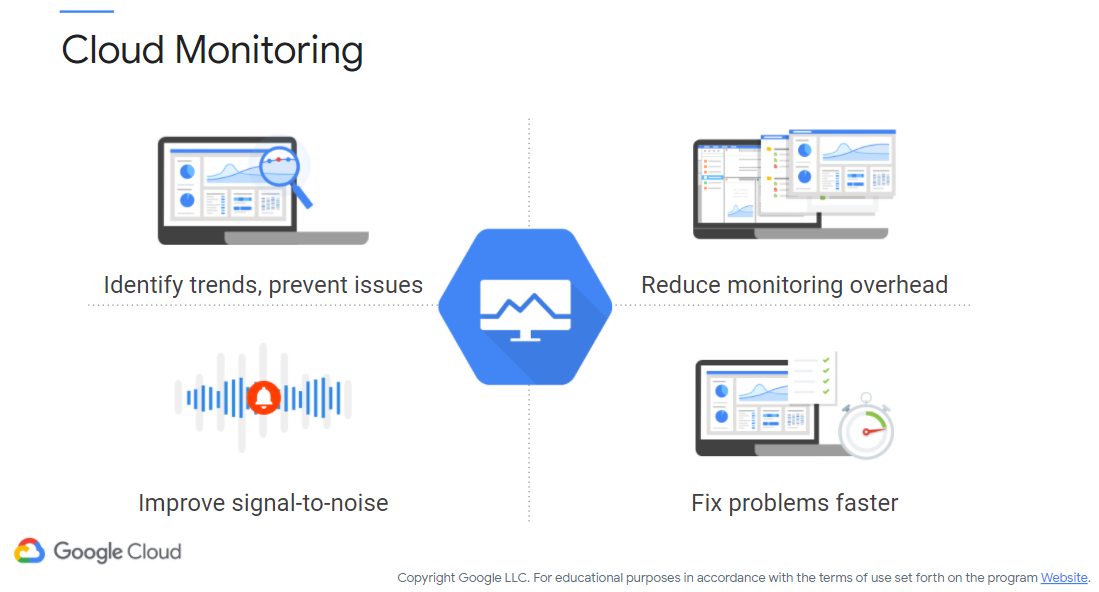
Figure 4: Google Cloud Monitoring
Cloud Logging
You should have experience Cloud Logging already, however it features fully in the operations suite. It integrates with the other tools here (Monitoring, Trace, Error Reporting, and Debugger) to enable you to quickly root cause problems. Think of it as a nice interface to logs you may already experience in your common IT tasks, however cloud-focused and centralized.
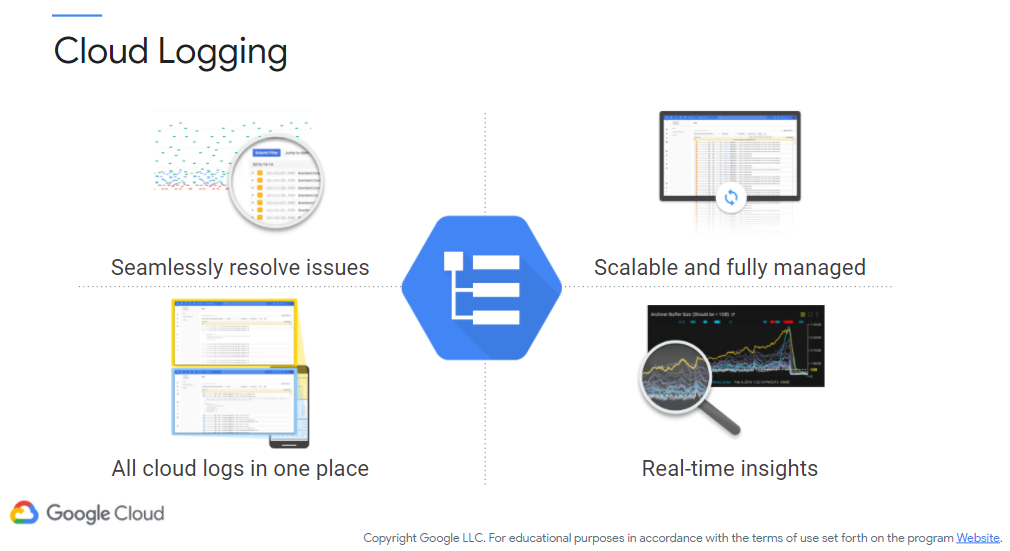
Figure 5: Google Cloud Logging
As we are in the cloud, the Logging service is intended to very quickly provide you with metrics that you need (for instance, latency monitoring, real-time system logging, etc.). You can also get into advanced log analytics (as you might with a tool such as Splunk).
Cloud Error Reporting
With Error Reporting you can get alerts as to exceptions in real time, as well as aggregated in a dashboard for later analysis. Error Reporting essentially analyzes the exceptions flowing through your cloud services and aggregates them in a manner suitable to the needs of your language/framework. Multiple languages, such as Go, Java, .NET, Node.js, Python, PHP, and Ruby are currently supported for monitoring. RESTful calls are also supported from your language of choice.
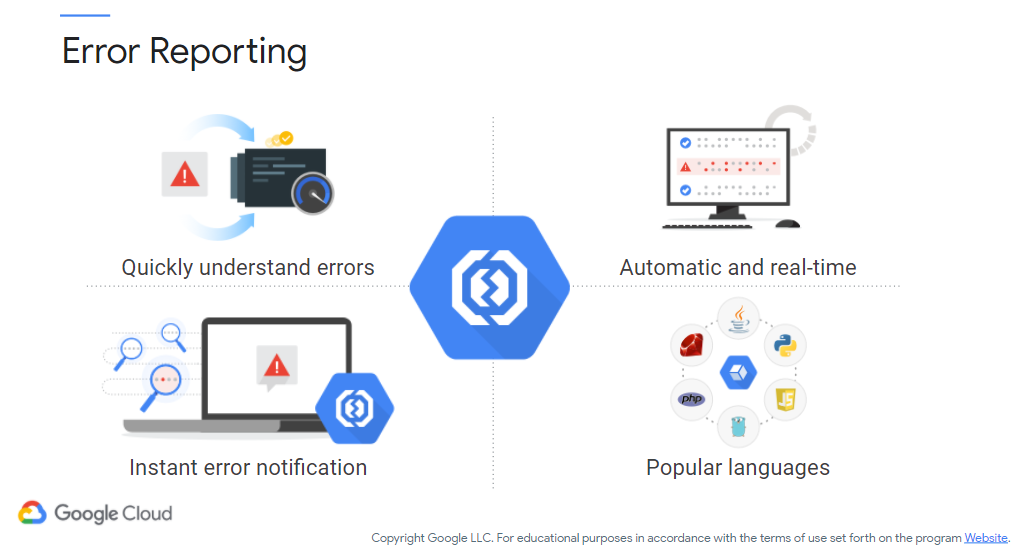
Figure 6: Google Cloud Error Reporting
Cloud Trace
Cloud Trace is a service for tracing your applications/services and aggregating latency information within the Cloud Console. You can use this service for checking responsiveness, bottlenecks, etc. Here, reports can also be generated as well. Definitely a useful tool for profiling your cloud applications!
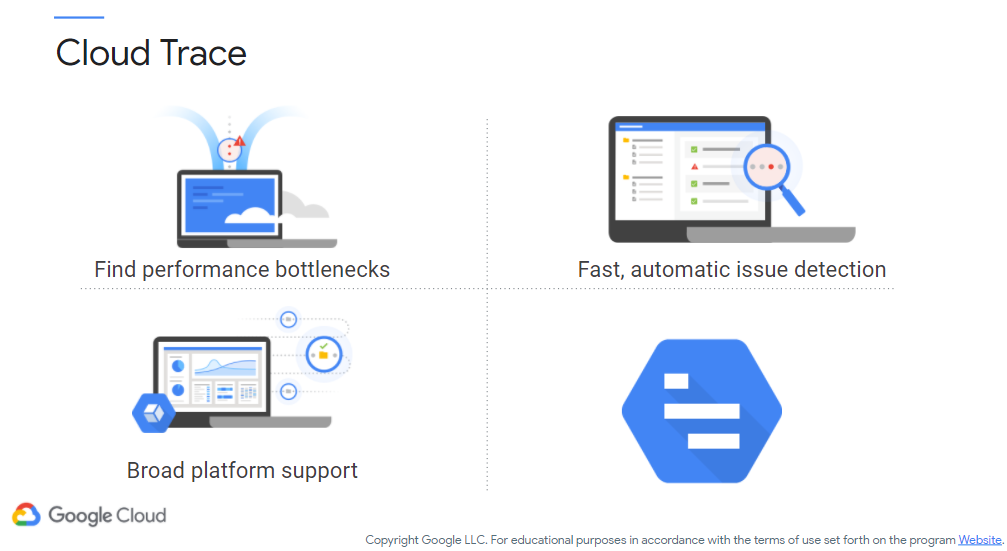
Figure 7: Google Cloud Trace
Cloud Debugger
Debugger enables you to debug your applications in real time without stopping it. Here, you can take a snapshot of your running application and inject logging statements, where the new logging statements are then output as though they were part of the running application. One nice aspect is that debug sessions can be shared as well by sharing the URL of the console in question.
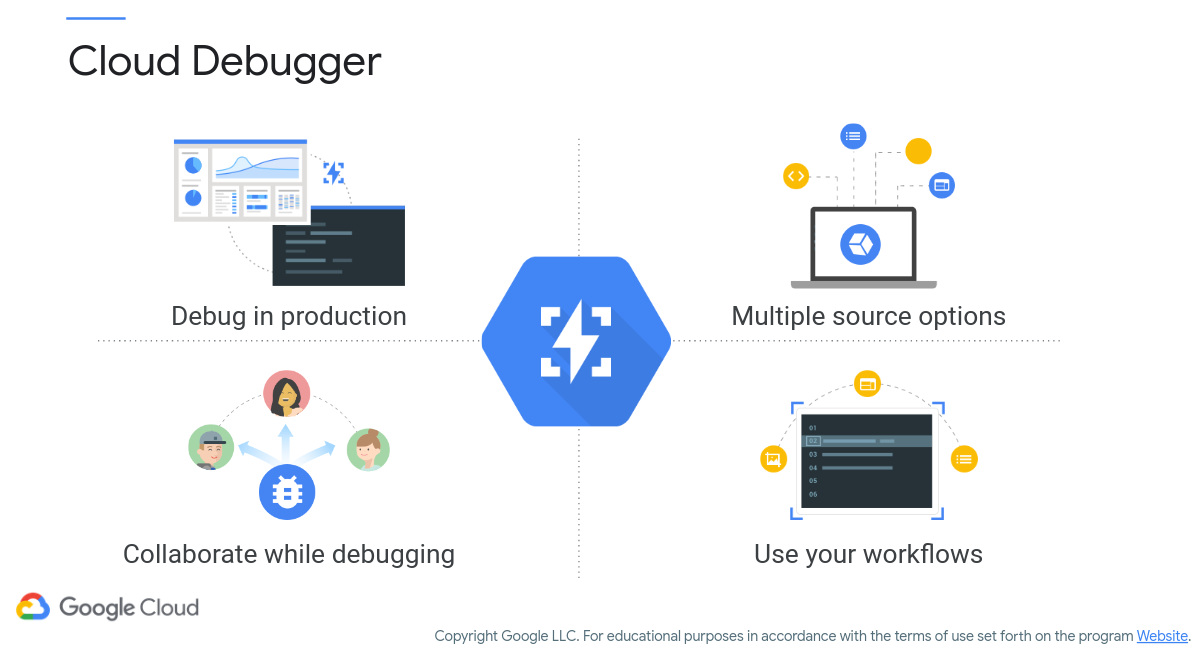
Figure 8: Google Cloud Debugger
Cloud Profiler
Last but not least, we have Profiler. This service watches CPU and memory of your running applications, using statistical techniques to determine where problems may lie within your application. You can actually use this in and outside of the Google environment (e.g., check other cloud services).
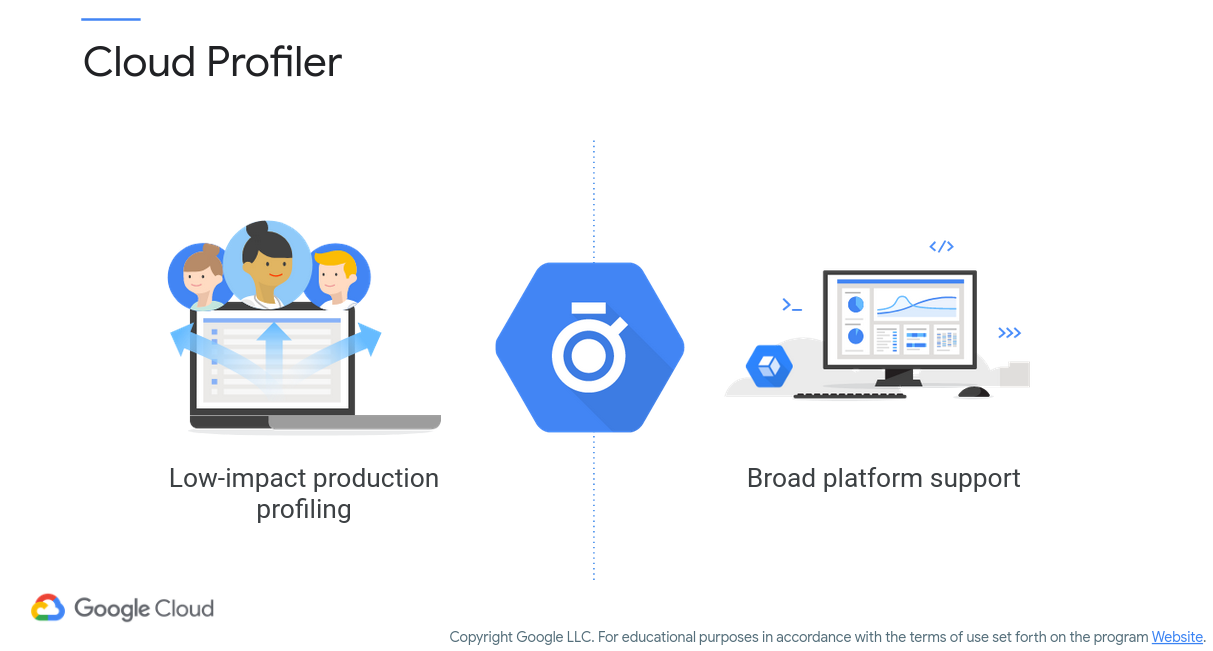
Figure 9: Google Cloud Profiler
The following video shows an overview of some of our automation and debugging tools, focusing on monitoring and logging with special guest appearances by Cloud Functions and Error Reporting.
Lab!
Let’s get up and running with Cloud Monitoring and Logging. This lab will help you understand some of these tools we’ve shown you.
If you want additional experience you can try these ones out, but I’ll just be grading the one above.
- QwikLabs - Cloud Monitoring: Qwik Start [1 credit]
- Codelabs - Analyze Production Performance with Cloud Profiler
Additional Resources
Where noted, the original content was provided by Google LLC and modified for the purpose of the course, without input or endorsement from Google LLC.